
This website uses cookies to improve user experience.


On this page we will explain how to make a Gantt chart. If you need to understand the concept of the Gantt chart, you can read: What is a Gantt Chart?
Gantt charts are created using project management information system (PMIS) applications, such as Primavera Project Planner®, Microsoft Project®, and MindView®. A typical approach for creating a schedule is to hold meetings with selected project team members and to begin identifying activities. While this approach will result in a schedule, it may not be a complete schedule. A complete schedule contains enough activities to ensure compliance with the 100% Rule. The 100% Rule requires that the scope baseline addresses 100% of the project scope. The scope baseline components are the primary sources used to identify the schedule activities. If the scope baseline addresses 100% of the project scope, then the schedule activities address 100% of the project scope. Following these steps will ensure that the final project schedule is a complete schedule.
Gather the team and review the approved scope baseline, which consists of three components: 1) the Scope Statement, 2) the Work Breakdown Structure (WBS) and 3) the WBS Dictionary. The project team member should confirm that the scope baseline addresses 100% of the project scope.
Using a technique called Decomposition, the project team breaks down each WBS work package into activities. Just like when creating the WBS work packages, the team needs to set rules for creating schedule activities. The final schedule needs to be the one that is effective and efficient. Too many activities can be as bad as too few. It is also important to identify deadlines and milestones while decomposing the project.
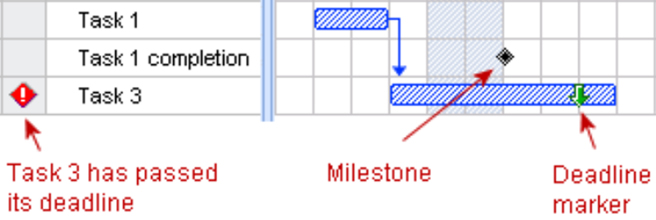
Gantt chart deadlines passing
Every activity is related to one or more other activities. Every activity, except the first and last, has a relationship with a predecessor and a successor. Sequencing activities means placing the activities in the right order using the right relationships. There are four types of relationships:
Relationships 1 and 2 are the most commonly used. Finish to Start is a sequential relationship and Start to Start is typically a parallel or over-lapping relationship.
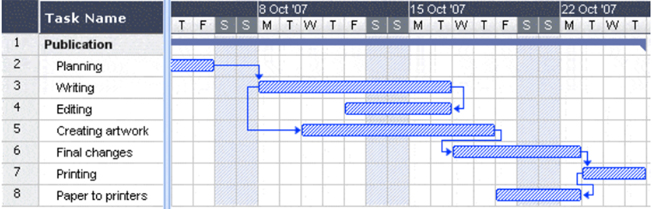
Gantt chart dependencies
Before the durations can be estimated, resources must be identified and estimated. Resources include labor, material and equipment. There are several estimating techniques used including Analogous, Parametric, Three-Point and Bottom Up. Skills, competencies and technology are key factors to consider in the basis of the estimate. After estimating the resources, they are loaded in the schedule against the respective activities. A resource calendar is also created to show when resources are needed and available.
Duration is the time between the start and end of an activity. Review the resources, relationships and sequencing, then estimate the duration for each activity. The same estimating techniques used for estimating resources can be used to estimate durations, but make sure you identify constraints. Which are limitations or restrictions on an activity.
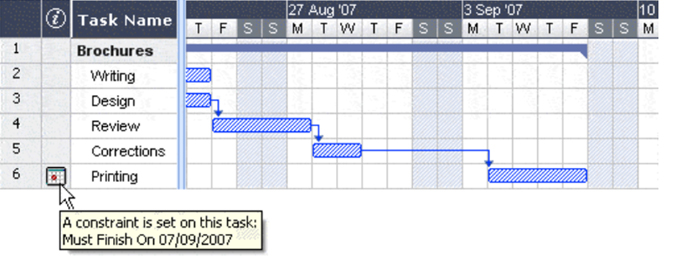
Gantt chart constraints
Create the Gantt chart by loading all information into a project management software tool. Review the schedule and ensure that all schedule risks have been addressed. Check that response plans and schedule contingencies have been included. A typical way to address schedule contingencies is to add Buffers at the activity level, the project level or both. A Buffer is an activity with no resources or scope to provide additional time and reduce schedule risks. Resource optimization techniques, such as resource smoothing or leveling are used to create realistic schedules. Review and approve the schedule. The approved Gantt chart schedule becomes the schedule baseline.
The Gantt chart schedule baseline is the formal document used to execute, monitor and control the project schedule performance. The project team members were assigned work packages in the Work Breakdown Structure. The respective team members status their work package activities using a disciplined method. There are two statusing methods commonly used: 1) Percent complete and 2) Earned Value Management System (EVMS). Percent complete is simple to use, but can be somewhat subjective. EVMS, on the other hand, measures schedule performance based on the value of the work accomplished.
The actual schedule performance is compared to the planned performance to identify variances. Special attention is applied to the Critical Path activities. The Critical Path is the longest path in the schedule and has zero float. It is referred to as critical because any delay in a critical path activity results in the same delay in the project end date. The Critical Path is usually colored red when shown in Gantt charts. If the variance exceeds an established threshold, the project team needs to consider taking either preventive or corrective action. Only if the variance cannot be adequately addressed by these actions should the project team issue a change request to formally change the baseline.
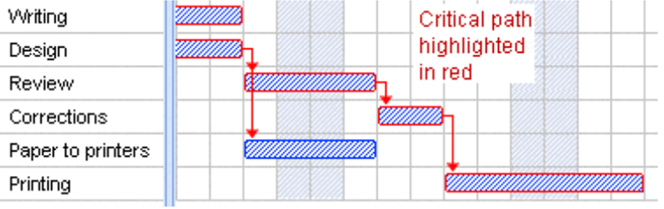
Gantt chart highlighting critical path
There are a number of techniques available to take actions to address variances. The project team can add Leads or Lags. A Lead is an intentional adjustment to an activity by making the start date earlier than planned. A Lead can be used to accelerate the schedule. However, schedule risk is typically increased. Similarly, a Lag is an intentional adjustment to an activity that delays the start date. If making a Lead or a Lag, the schedule relationship remains the same. In addition, if only schedule acceleration is needed, then there are two techniques used without reducing scope. These two techniques are: 1) Fast Tracking and 2) Crashing. Fast tracking is increasing the overlapping of activities and can result in increased risks. Crashing is increasing resources and can result in increased costs.
Another use of a Gantt chart is to forecast schedule performance. Gantt charts are excellent tools to forecast project schedules. Many have forecasting methods to compute Estimate-to-Complete and Estimate-at-Completion. Earned Value techniques are also incorporated in many of the scheduling applications for forecasting.